Workflow results
Example
All the figures and graphs shown as examples were obtained by running Methylator with the test dataset. The parameters used to produce the results are the default settings in the configuration file. All analysis reports in HTML format are available here.
The results are separated into two folders :
- the big files : trimmed FASTQ, BAM files, RData objects are in the data folder defined in
configs/config_main.yamlatBIGDATAPATH
## paths for intermediate and final results
BIGDATAPATH: /shared/projects/YourProjectName/Methylator/Big_Data # for big files
[username@clust-slurm-client Methylator]$ tree -L 2 Big_Data/EXAMPLE/
Big_Data/EXAMPLE/
.
├── Annotation
│   └── Annotatr.RData
├── hg38.chrom_sizes
├── mapping_BOWTIE2
│   ├── bam_byName
│   ├── bismark_genome
│   ├── chrom.sizes
│   ├── Deduplicate
│   └── Meth_Extractor
├── Methylator_WGBS
│   └── Rdata
└── trimmed
    ├── SRR1067571_R1_clean_fastqc.html
    ├── SRR1067571_R1_clean_fastqc.zip
    ├── SRR1067571_R1_clean.fastq.gz
    ├── SRR1067571_R1.fastq.gz_trimming_report.txt
    ├── SRR1067571_R2_clean_fastqc.html
    ├── SRR1067571_R2_clean_fastqc.zip
    ├── SRR1067571_R2_clean.fastq.gz
    ├── SRR1067571_R2.fastq.gz_trimming_report.txt
    ...
- the small files: QC reports, BigWig, Analysis reports, etc. are in the final result folder defined in
configs/config_main.yamlatRESULTPATH
[username@clust-slurm-client Methylator]$ tree -L 2 Results/EXAMPLE/
.
├── logs
│   ├── 20231120T1447_configuration.txt
│   ├── 20231120T1447_free_disk.txt
│   ├── 20231120T1447_mapping.txt
│   ├── 20231120T1447_running_time.txt
│   ├── 20231120T1447_trim_report.txt
│   ├── 20231120T1447_trim.txt
|   |    ...
├── mapping_BOWTIE2
│   ├── alignmentQC
│   ├── BigWig
│   ├── bismark_summary_report.html
│   ├── bismark_summary_report.txt
│   ├── mapping_report_SRR11806587_sub500000_chr19.html
│   ├── mapping_report_SRR11806588_sub500000_chr19.html
|   |   ...
│   └── multiqc
├── Methylator_WGBS
│   ├── Annotatr.log
│   └── CpG_mincov5
└── trimmed
    ├── fastqc_trimming
    └── trimming
This way you can get all the results on your computer by running (from your computer):
You@YourComputer:~$ scp -pr username@core.cluster.france-bioinformatique.fr:/shared/projects/YourProjectName/Methylator/results/EXAMPLE/ PathTo/WhereYouWantToSave/
and the huge files will stay on the server. You can of course download them as well if you have space (and this is recommended for the long term).
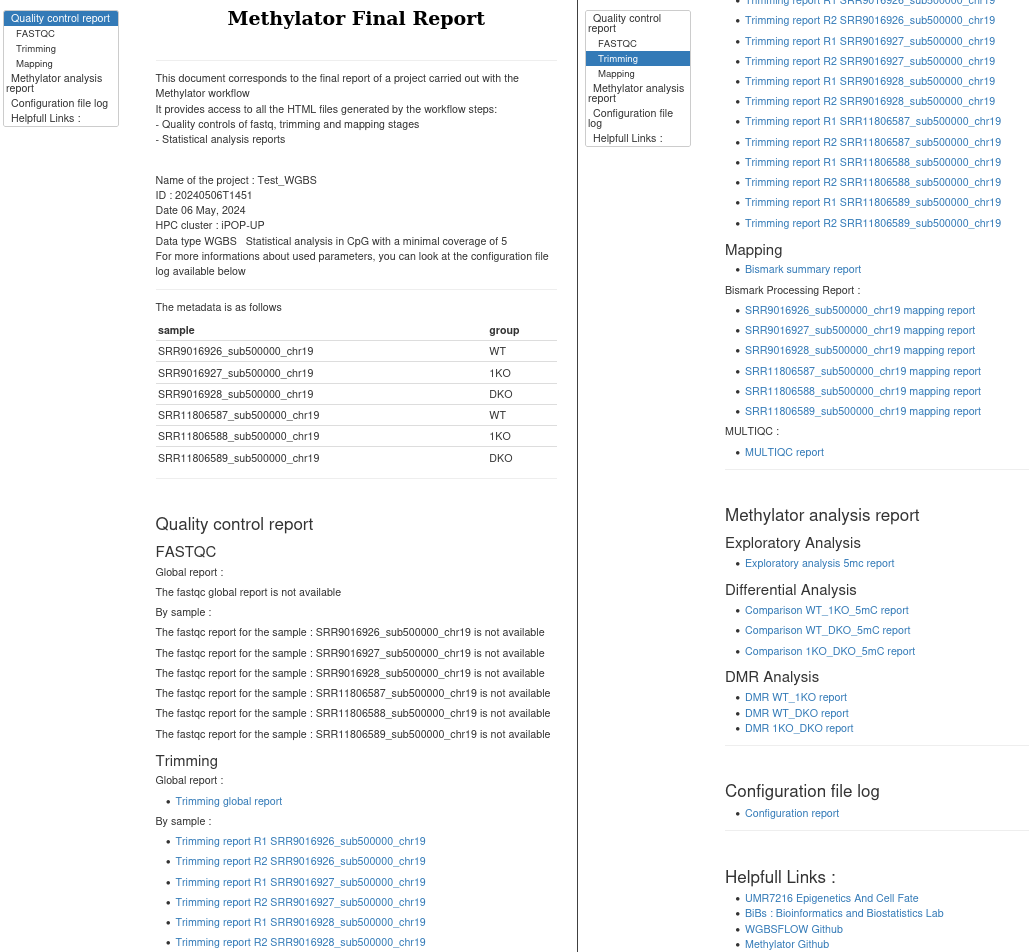
Final report
A report named as 20210727T1030_report.html summarizes your experiment and your results. You'll find links to fastQC results, to mapping quality report, to exploratory analysis of all the samples, to pairwise differential methylation analyses and finally to ORA analyses. They are very helpful to dig into the results.
A compressed archive named 20210727T1030_report.tar.bz2 is also generated and contains the report and the targets of the different links, excluding big files to make it small enough to be sent to your collaborators.
[username@clust-slurm-client Methylator]$ tree -L 2 Results/EXAMPLE/20210727T1030_project_name_report

20240506T1451_project_name_report
├── 1KO_DKO_5mC.html
├── 1KO_DKO_DMR.html
├── bismark_summary_report.html
├── Exploration_5mC.html
├── final_report_Test_WGBS.html
├── report_mapping_bismark.html
├── report_quality_control_after_trimming.html
├── SRR11806587_sub500000_chr19_R1_clean_fastqc.html
├── SRR11806587_sub500000_chr19_R2_clean_fastqc.html
├── SRR11806588_sub500000_chr19_R1_clean_fastqc.html
├── SRR11806588_sub500000_chr19_R2_clean_fastqc.html
├── SRR11806589_sub500000_chr19_R1_clean_fastqc.html
├── SRR11806589_sub500000_chr19_R2_clean_fastqc.html
├── SRR9016926_sub500000_chr19_R1_clean_fastqc.html
├── SRR9016926_sub500000_chr19_R2_clean_fastqc.html
├── SRR9016927_sub500000_chr19_R1_clean_fastqc.html
├── SRR9016927_sub500000_chr19_R2_clean_fastqc.html
├── SRR9016928_sub500000_chr19_R1_clean_fastqc.html
├── SRR9016928_sub500000_chr19_R2_clean_fastqc.html
├── WT_1KO_5mC.html
├── WT_1KO_DMR.html
├── WT_DKO_5mC.html
└── WT_DKO_DMR.html
Tip for Windows users
Unlike Linux and Mac, the tar.bz2 format is not natively supported by Windows, but you can use the free PeaZip or 7-zip softwares to decompress the final_report_{project}.tar.bz2 archive.
The final report look like this :
Detailed description of all the outputs of the workflow is included below.
Trimmed reads
After trimming, the FASTQ are stored in the data folder defined in configs/config_main.yaml at BIGDATAPATH:.
In this examples the trim FASTQ files will be stored in /shared/projects/YourProjectName/Methylator/data/EXAMPLE/trim/.
They are named :
- Sample1_R1_val_1.fq
- Sample1_R2_val_2.fq
Trimming report
In results/EXAMPLE/trimming you'll find trimming reports such as Sample1_forward.fastq.gz_trimming_report.txt for each samples. You'll find information about the tools and parameters, as well as trimming statistics:
SUMMARISING RUN PARAMETERS
==========================
Input filename: /shared/projects/wgbs_flow/Nanopore_data/ONT_data/rrms_2022.07/bisulfite/raw_data/COLO1_R1.fq.gz
Trimming mode: paired-end
Trim Galore version: 0.6.7
Cutadapt version: 4.2
Python version: could not detect
Number of cores used for trimming: 4
Quality Phred score cutoff: 28
Quality encoding type selected: ASCII+33
Using Illumina adapter for trimming (count: 37651). Second best hit was Nextera (count: 0)
Adapter sequence: 'AGATCGGAAGAGC' (Illumina TruSeq, Sanger iPCR; auto-detected)
Maximum trimming error rate: 0.1 (default)
Minimum required adapter overlap (stringency): 1 bp
Minimum required sequence length for both reads before a sequence pair gets removed: 20 bp
All Read 1 sequences will be trimmed by 10 bp from their 5' end to avoid poor qualities or biases
All Read 2 sequences will be trimmed by 10 bp from their 5' end to avoid poor qualities or biases (e.g. M-bias for BS-Seq applications)
All Read 1 sequences will be trimmed by 9 bp from their 3' end to avoid poor qualities or biases
All Read 2 sequences will be trimmed by 9 bp from their 3' end to avoid poor qualities or biases
Running FastQC on the data once trimming has completed
Output file will be GZIP compressed


This is cutadapt 4.2 with Python 3.7.12
Command line parameters: -j 4 -e 0.1 -q 28 -O 1 -a AGATCGGAAGAGC /shared/projects/wgbs_flow/Nanopore_data/ONT_data/rrms_2022.07/bisulfite/raw_data/COLO1_R1.fq.gz
Processing single-end reads on 4 cores ...
Finished in 148.610 s (3.960 µs/read; 15.15 M reads/minute).

=== Summary ===

Total reads processed:              37,527,910
Reads with adapters:                19,815,625 (52.8%)
Reads written (passing filters):    37,527,910 (100.0%)

Total basepairs processed: 1,876,395,500 bp
Quality-trimmed:              11,610,210 bp (0.6%)
Total written (filtered):  1,798,598,760 bp (95.9%)

=== Adapter 1 ===

Sequence: AGATCGGAAGAGC; Type: regular 3'; Length: 13; Trimmed: 19815625 times

Minimum overlap: 1
No. of allowed errors:
1-9 bp: 0; 10-13 bp: 1

Bases preceding removed adapters:
  A: 49.8%
  C: 24.1%
  G: 13.9%
  T: 12.2%
  none/other: 0.0%

Overview of removed sequences
length  count   expect  max.err error counts
1   14655096    9381977.5   0   14655096
2   252919  2345494.4   0   252919
3   408890  586373.6    0   408890
[...]

RUN STATISTICS FOR INPUT FILE: /shared/projects/wgbs_flow/Nanopore_data/ONT_data/rrms_2022.07/bisulfite/raw_data/COLO1_R1.fq.gz
=============================================
37527910 sequences processed in total
This information is summarized in the MultiQC report, see below.
FastQC of trimmed reads
After the trimming, fastQC is automatically run on the new FASTQ and the results are also in the folder results/EXAMPLE/fastqc_trimming/:
- Sample1_R1_trimmed_fastqc.html
- Sample1_R1_trimmed_fastqc.zip
- Sample1_R2_trimmed_fastqc.html
- Sample1_R2_trimmed_fastqc.zip
As previously MultiQC gives a summary for all the samples : results/EXAMPLE/fastqc_trimming/report_quality_control_after_trimming.html.
You'll find information from the trimming report (for instance you can rapidly see the % of trim reads for the different samples) as well as from fastQC.
It is included in the final report (ie ????.html).
Mapped reads
The mapped reads are stored as deduplicated, sorted bam in the data folder, in our example in Big_Data/EXAMPLE/mapping_BOWTIE2/Deduplicate/, together with their .bai index. They can be visualized using a genome browser such as IGV but this is not very convenient as the files are heavy. BigWig files, that summarize the information converting the individual read positions into a number of reads per bin of a given size, are more adapted.
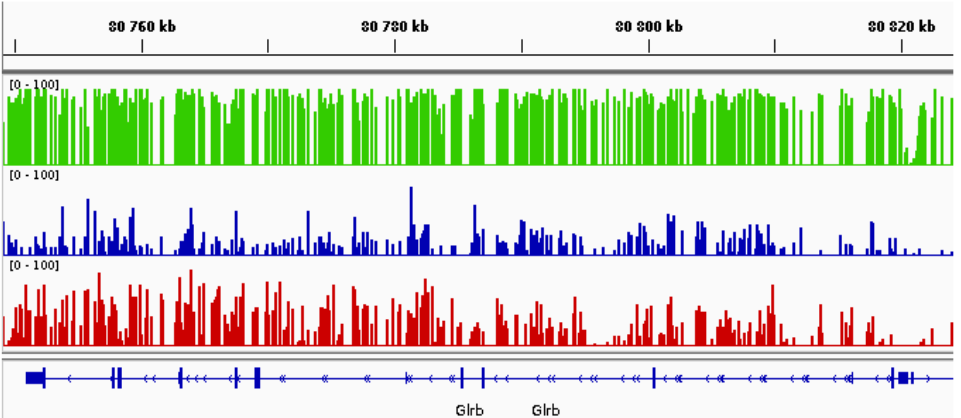
BigWig
To facilitate visualization on a genome browser, BigWig files are generated. Pour chaque échantillon un bigwig de couverture et de pourcentage de méthylation est crée :
- {SAMPLE_NAME}_5mC_MethCov.bw
- {SAMPLE_NAME}_5mC_MethPerc.bw
Les filtres utilisés pour générer les BigWig sont ceux du fichier de configuration :
# ===== Exploratory analysis ===== #
## params
MINCOV: 5  # int, minimum coverage depth for the analysis
COV.PERC: 99.9 # to the coverage filter, choose the percentile for remove top ..% (MKit_diff_bed.R and MKit_Exploration.Rmd)
MINQUALI: 20  # int, minimum quality to keep a CPG for the analysis
You@YourComputer:~$ scp -pr username@core.cluster.france-bioinformatique.fr:/shared/projects/YourProjectName/Methylator/??????, PathTo/WhereYouWantToSave/
Snapshot of BigWig tracks visualized on IGV. In this example, green sample correpond to the WT condition, blue sample to the simple KO and red to the double KO.
Mapping QC
Qualimap is used to check the mapping quality. You'll find qualimap reports in Results/EXAMPLE/mapping_BOWTIE2/alignmentQC. Those reports contain a lot of information:
- information about the mapper
- number and % of mapped reads/pairs
- number of indels and mismatches
- coverage per chromosome
- insert size histogram
Once again MultiQC aggregates the results of all the samples and you can have a quick overview by looking at Results/EXAMPLE/mapping_BOWTIE2/multiqc/report_mapping_bismark.html or in the final report (ie final_report_{project}.html).
Statisical analysis results
All files of the staticticals analysis are in Results/EXAMPLE/Methylator_{DATATYPE}/{LEVEL}_mincov{MINCOV}/
DATATYPE corresponding to the type of data ( : WGBS, RRBS or NANOPORE).
LEVEL corresponding to the level of analysis (per base or tiles).
And MINCOV corresponding at the minimum of coverage choose for retain CpG.
Note
So, with the same samples, if you change this parameters to perform a new analysis a new folder is created for don't overwrite laste files.
Exploratory methylation analysis results
Exploratory methylation results are in Results/EXAMPLE/Methylator_{DATATYPE}/{LEVEL}_mincov{MINCOV}/exploratory/
This folder contain :
- a HTML report file
- a folder
Exploration_5mC_files/figure-htmlavec toutes les figures généré par le rapport au format .PNG
Examples of figures that you may see in the exploratory analysis report :

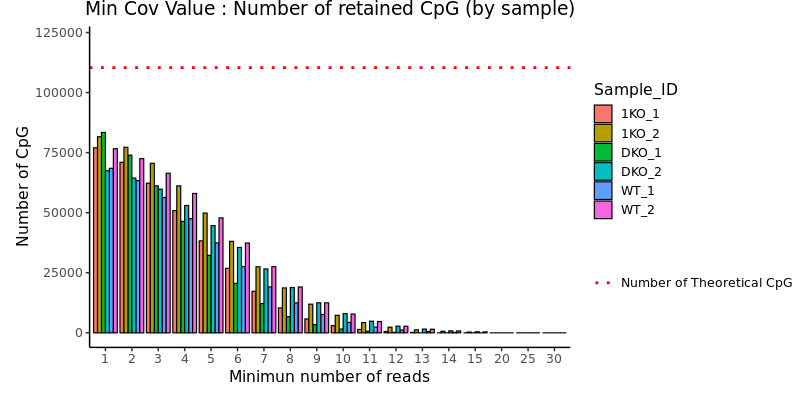
Most of the figures allow for identifying whether the biological samples are sufficiently distinct to decide on conducting a differential analysis (e.g., PCA), and in this case, to choose the appropriate parameters (e.g., min cov).
Differential methylation CpG or Tiles (DMC/DMT) results
Differential methylation results are in Results/EXAMPLE/Methylator_{DATATYPE}/{LEVEL}_mincov{MINCOV}/differential/
This folder contain :
- a HTML report file for each comparison (indicate in the config file)
-
a bed folder for each comparisons with :
-
- a bed file for all DMC/DMT
-
- a bed file for significants DMC or DMT
-
- a bed file for hyper-methylated significants DMC or DMT
-
- a bed file for hypo-methylated significants DMC or DMT
Warning
Each BED file is generated for every combination of values from the LIST_DIFF and LIST_QV lists. So, if LIST_DIFF has 4 threshold values and LIST_QV has 4 threshold values, we will generate 16 times the BED files for each condition, resulting in 16x4x3 = 192 bedgraphs
Examples of figures that you may see in the differentialy analysis report:

Differential methylation (DMR only) results
Differential methylation results are in Results/EXAMPLE/Methylator_{DATATYPE}/{LEVEL}_mincov{MINCOV}/DMR/
This folder contain for each comparison a folder with :
- a HTML report file (indicate in the config file)
- a CSV file with all DMRs detected
- a CSV file with only significant DMRs
- a CSV file with only significant DMRS associate with genes annotations
For the 10 most significant DMRs, you will find this type of figures in the report. This includes information such as the chromosomal position of the DMR, its size, its FDR, and associated annotations (genes and CpG islands, shores, shelves).

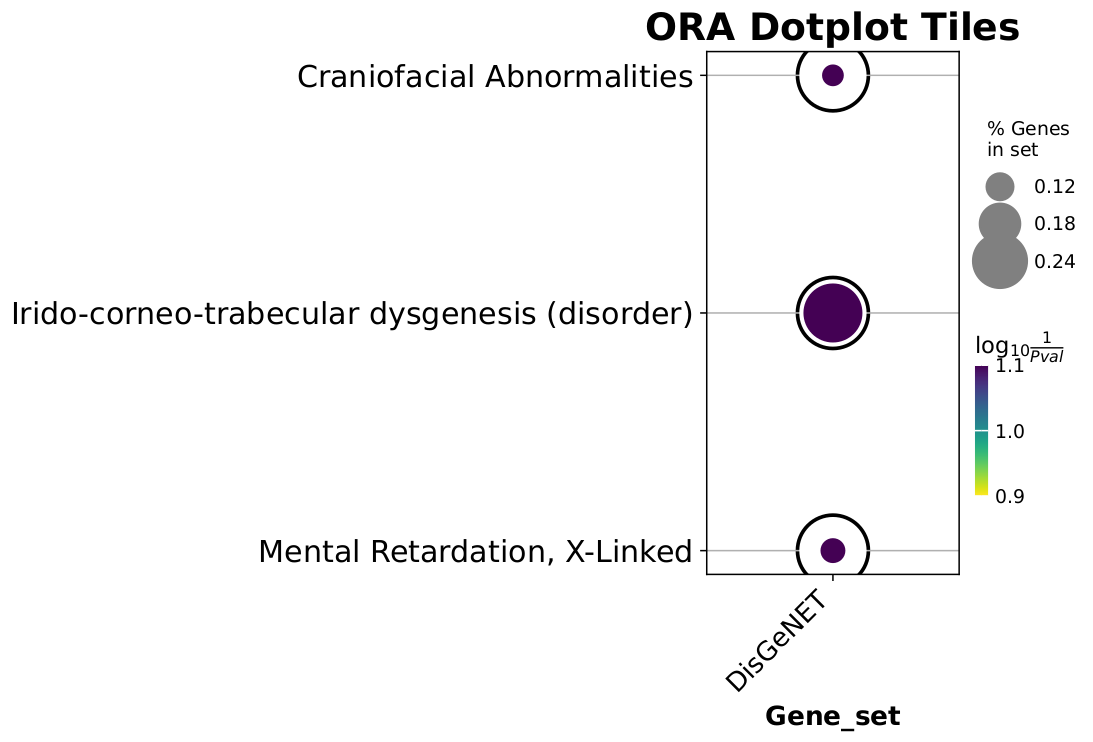
Over-representation analysis (ORA)
ORA results are in Results/EXAMPLE/Methylator_{DATATYPE}/{LEVEL}_mincov{MINCOV}/ORA/
This folder contain :
- a folder
log
And for each comparaison :
- a file
barplot_{LEVEL}_{COMPARISON}_{5mc/5hmc}.pdf - a file
dotplot_{LEVEL}_{COMPARISON}_{5mc/5hmc}.pdf
Example of ORA figures
Note
All this HTML files are included in the final report. An example of this report, generate with the test dataset, is avaible here.